Graphics debuggers have become much more capable of educating developers. They can be used to generate code so developers can better understand what's needed to execute commands, provide key insights for developers to better optimize their titles by showing shader disassembly/ISA, and show the memory layout of buffers in a given application to better detect errors. They've even enabled individuals to perform renderer studies like those done by Adrian Courrèges [Courrèges 2017] and myself, and feature a variety of incredibly useful insights and features:
-
Generated C++ from NVIDIA NSight Graphics showcases not just an example implementation of an application's rendering architecture but also how to write such an architecture in most modern graphics APIs (Vulkan, DirectX 11/12, and OpenGL).
-
Shaders can be edited in the debugger with the results propagating instantly saving you a shader compilation refresh in your application.
-
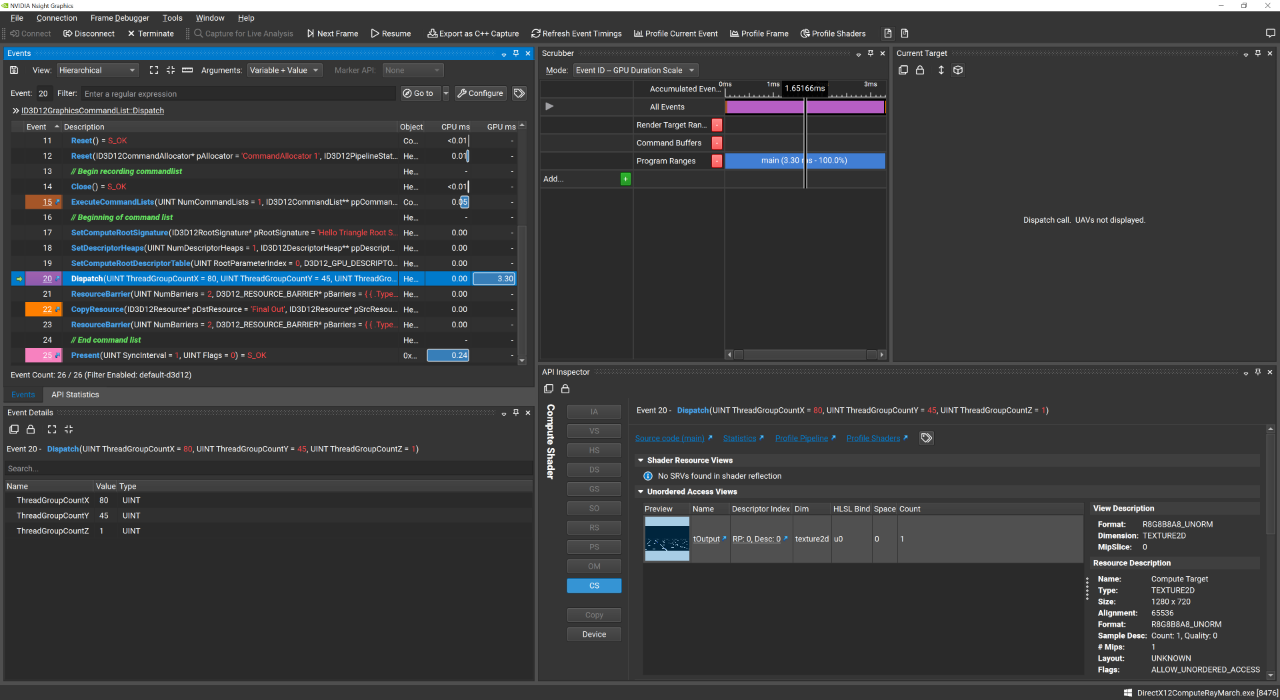
Profiling tools help developers see more of their application's shortcomings, from what's slowing down the execution of a single Dispatch command the most to getting high level insights of the timing of render passes for given frame.
The following is an attempt at summarizing shared aspects of a variety of graphics debuggers, and how you can use these features to optimize and debug your graphics applications.
Overview
Currently there exists the following graphics API debuggers (with a few depreciated ones not listed):
Each of which for the most part share all the same features:
-
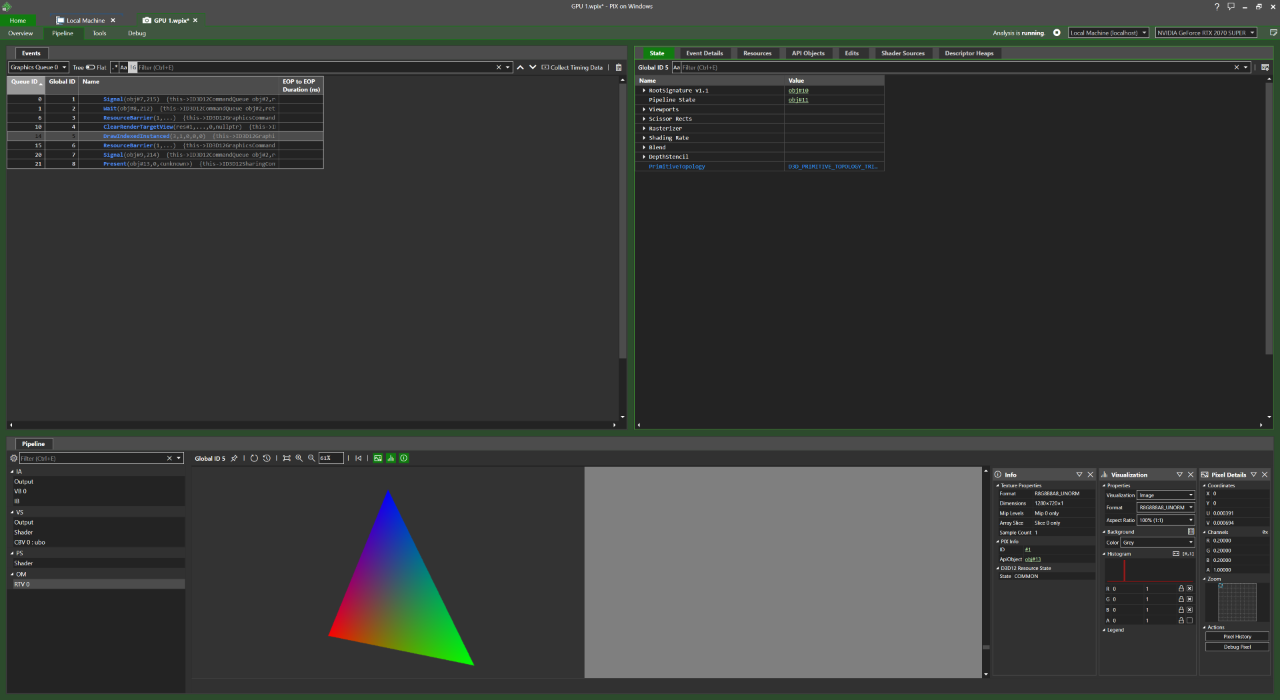
Per Command Analysis with grouping support with the PIX event runtime or vendor specific markers.
-
Frame Buffer Attachment Analysis with the ability to adjust color weights for better visualization.
-
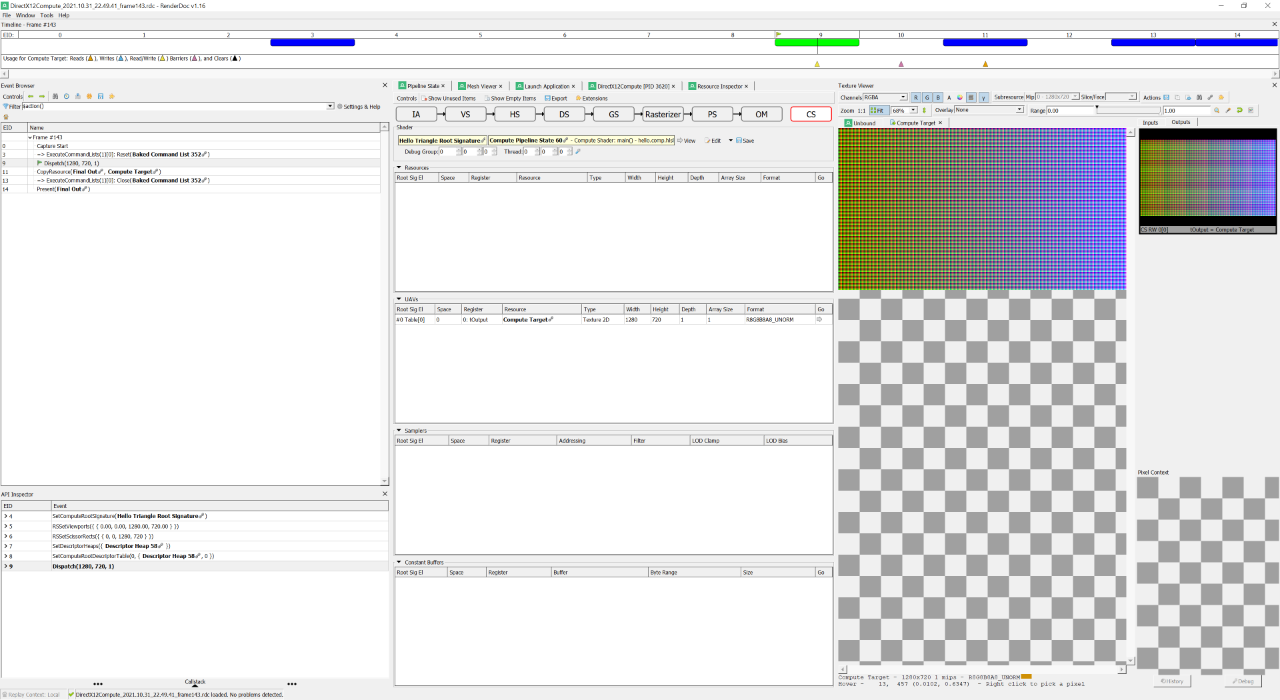
Mesh visualizations, be it Bottom Level Acceleration Data Structures (BLAS') or how verticies are transformed by the vertex shader.
-
Buffer Exploration (uniforms, vertex, structured, textures, etc.)
-
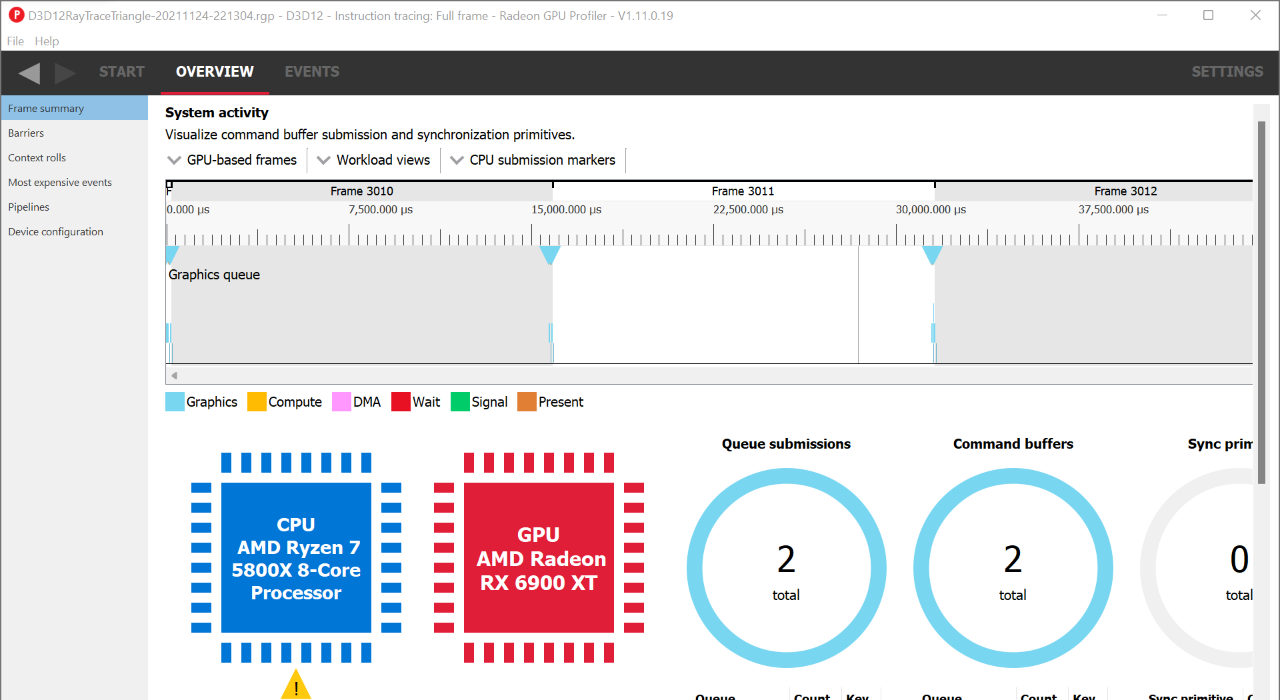
Profiling every aspect of rendering, from execution time for render passes to individual calls.
-
Shader Editing and seeing those changes propagate in the frame capture.
Though GPU Vendor specific tools such as AMD's Radeon GPU Profiler, NVIDIA NSight Graphics, or Intel GPA tend to share more information about their platform. NVIDIA NSight Graphics also features a C++ project generator, perfect for learning the rendering architecture of a given application. Microsoft PIX is one of the few debugging tools that can be used for Windows 10 UWP applications.
Having information on individual shader execution, execution times for draw calls, render passes, etc. is extremely valuable since it will help you with achieving the maximum throughput of your GPU (otherwise known as Speed of Light or SOL) [Bavoil 2018], and if your application isn't running close to SOL then you're wasting cycles and leaving performance on the table.
GPU Architecture
Graphics Processing Units (GPU)s typically execute thousands of threads concurrently (also known as executing work items) in groups called thread groups (or work-groups). Such bundles of threads are known as Warps (NVIDIA) or WaveFronts (AMD) [Moth 2012]. If your shader code does anything to prevent the threads of a work group from executing concurrently, this can introduce divergence by keeping threads from being able to continue processing that code during a given cycle.
In addition to simply shader processing, the GPU must execute a given Pipeline (be it Raster, Compute, Tensor, or Ray Trace), and depending on the complexity of a pipeline, a graphics API call can take longer to execute on the GPU.
Each stage of a graphics pipeline could have varying amounts of:
-
Stall Drain - Active warps that are stalled after exit for all memory instructions to complete so warp resources can be freed.
-
Texture Stall Cycles - The number of cycles a texture request (TEX TEXIN) is stalled awaiting data from texture header or sampler L2 (TSL2) cache.
With NVIDIA NSight Graphics you'll want to analyze these statistics, or as a general rule of thumb refer to Shader Model Throughput for Active Cycles, which is how close the current API call is to achieving SOL.
Capture
-
PIX - Press the green GPU Capture button on the app or Print Screen.
-
Radeon GPU Profiler - Requires having Radeon Developer Panel open, Press Capture Profile or CTRL+ALT+C.
Conclusion
In NVIDIA NSight Graphics, the best summary of performance is its Top SOLs metric. Here's a checklist of different aspects of your application that you should be paying attention to when optimizing your graphics application:
-
is your app CPU limited? This means that you're unable to send the GPU new work fast enough due to something CPU bound stalling the execution of API calls in your app.
-
Are there Wait for Idle commands due to pipeline switches? Changing the pipeline of a given application is inevitable, but if you could keep changes to a minimum, that can improve performance.
-
Is there too much Texture fetching? Texture memory is fast but depending on the computation, it could be faster to procedurally compute a given value you're reading from a texture (though this is rare).
-
Are you using 16 bit index buffers for raster rendering? This can massively increase the performance of your app!
-
How big are your render pass attachments? Could you encode normals for example in 2 channels using Sphere Map Transform Encoding by Martin Mittring [Pranckevičius 2010]. Uncharted 4 by Naughty Dog features a more granular packing of render attachments, by packing various attachments into 2 RGBA16 G-Buffers [El Garawany 2016].
More Resources
[Courrèges 2017]
|
[Olmstead 2014]
Optimizing WebGL ApplicationsDom OlmsteadGoogle Developers 2014
youtube.com |
[Bavoil 2018]
The Peak-Performance-Percentage Analysis Method for Optimizing Any GPU WorkloadLouis BavoilNVIDIA DevBlogs 2018
devblogs.nvidia.com |
[Moth 2012]
|
[Pranckevičius 2010]
|
[El Garawany 2016]
|
 Alain Galvan ·6/11/2019 8:36 PM · Updated 2 years ago